
In the past I had to deal with some performance issues, which were really tricky to narrow down. It turned out that the servers spent too much time in Garbage Collection for a protocol used by Outlook clients: MAPI over HTTP.
As this was not obvious and it took some time to identify, but the impact could be extremely critical, I thought it would makes sense to explain what happened and how you can avoid this situation.
Symptoms
During a migration from Exchange 2010 to Exchange 2013 we experienced the following issues:
- increasing number of HttpProxyOutStandingRequests
- poor Outlook performance in online and cached mode for migrated users (delays when switching folders or in mail delivery, sync issues)
- servers were marked as down by the load balancer, due to the fact that the response for the healthcheck run into a timeout
Troubleshooting
We started an investigation of the usual suspects like storage, CPU, network components and much more, but this did not reveal any issue. The servers seems to be totally relaxed. No high CPU usage, disk latencies or memory consumption.
We analyzed different kinds of log files using LogParser and scripts like Get-HttpProxy.ps1 or Get-IISStats.ps1. Here we could only see that high latency for the requests get logged, but we still couldn’t identify the root cause.
Only a deep analysis of the DailyPerformanceLogs revealed the issue:
The average for the performance counters % Time in GC were for longer time much higher than usual. The server spent too much time in Garbage Collection than serving client requests. This caused the increasing number of HttpProxyOutStandingRequests. As only the application pools MSExchangeMapiFrontEndAppPool and MSExchangeMapiMailboxAppPool suffered the issue, MAPI over HTTP was the only affected protocol. Exchange Web Services or Exchange Active Sync were not affected.
What is Garbage Collection?
.NET Framework has an automatic memory manager, which is responsible to free virtual memory used by your application. In our case the application is Exchange. Read more about it here:
.NET Garbage Collection Fundamentals
How do I find the right one for a specific protocol?
This is a little bit complicated. When you think you just need to add all the counters .NET CLR Memory(w3w*)\% Time in GC and check those, you’re wrong. The problem is that these counters have only the worker process in their name:
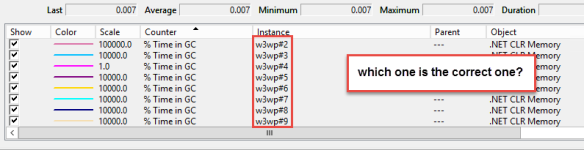
So it needs some extra work to find the correct one and therefor you need in total 3 different counters:
- .NET CLR Memory(w3w*)\% Time in GC
- .NET CLR Memory(w3w*)\Process ID
- W3SVC_W3WP(*)\Active Requests
In this example I want to determine the right counter for the application pool MSExchangeMapiFrontEndAppPool:
-
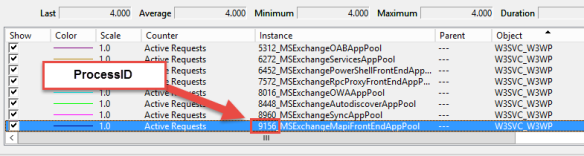
Determine the Process ID
Search the counter W3SVC_W3WP(*)\Active Requests with MSExchangeMapiFrontEndAppPool in the name. The number in the name is the corresponding .NET CLR Memory(w3w*)\Process ID.
-
Determine the name of the worker process
In this example the Process ID is 9156. Now search, which one of the counters .NET CLR Memory(w3w*)\Process ID has a value with 9156.

As we now have the name we can pick the right counter. In this case it’s the one with w3wp#5 as name.

Note: As the Process ID is changed, each time the application pool is recycled, you have to start with the process again to determine the correct counter! That is also the reason for multiple entries in the DailyPerformanceLogs as the workers might get recycled by Managed Availability.
Besides the manual steps outlined above, you can use my script and use the Verbose switch in addition to the TimeInGC one to gather the current ones:

Monitoring
As mentioned before the worker is changing. This means you should monitor all of those performance counters. Based on this KB2995145, the average of these counters % Time in GC should not exceed 10. At the same time you really should monitor also HttpOutStandingProxyRequests as this counter might give you the first indication for. But you need to have a baseline. For instance this environment is healthy with numbers between 2000 and 9000 (depending on working hours). If the values exceed 12000 we know that there is something wrong. Those numbers can varies in your environment. As mentioned in this post Ask the Perf Guy:
“We have also seen some cases in which the patterns of requests being serviced by Exchange, the number of CPU cores, and the amount of physical memory deployed on the server resulted in far more time being spent in the .NET Garbage Collection process than we would expect…”
It heavily depends on your environment. Especially the behavior of your clients.
Risks
If things go really bad the following major issues can occur as a result:
Massive increase of incoming TCP connections
This heavily depends on the affected protocol and how clients react, when requests are outstanding and queued. For sure Outlook is not a very patient and nice client.
Overload of the Front/Back-End components
The queue for incoming request can reach a critical level, where the server is unable to respond to. This could be the Front- or the Back-End component. Either way this could cause MA to trigger some action, which makes the situation worse. E.g.: Recycling of application pools, database failovers or restart of a server.
Healthchecks failing
Healthcheck are used on a load balancer to determine that a server is up and ready for client requests. Depending on the configuration a server, which is not able to respond properly to those checks, gets removed from the pool for client requests (which is the desired action) and it takes some time before it got added again. If a server got removed, the requests will be routed to another server, which might get then also into trouble.
Ephemeral port exhaustion
The worst scenario is that due to the high load of incoming requests a server is running out of available TCP ports. If this happens the server is almost dead and needs a restart.
Conclusion
All the risks mentioned above could lead into a domino effect, which knocks out server by server and take down your whole Exchange organization. Therefore I encourage you, if not yet done, to add those performance counters into monitoring.
If you see an increased average, don’t wait and open a case with Microsoft. But don’t panic. Some peeks are normal.
There are ways to tweak the servers, but this might be only a temporary relief.
Here are also some links related to this topic:
